


PRA Group, which buys and collects overdue consumer debt, enjoyed 20 years of profitability following its 2002 IPO. In 2023 it posted its first loss as a public company. As overdue US credit card balances continue to rise, the company’s outlook is improving. Trading at 1.1x tangible book value, a turnaround could spark a major re-rating.
Ticker: PRAA
Price: $20.86
Mkt Cap: $822 million
History
Steve Fredrickson and Kevin Stevenson, both industry veterans, established Portfolio Recovery Associates in 1996. In 2002 it listed on NASDAQ.
Post IPO the company did not disappoint. The macro environment didn’t matter. Ahead of the 2008 crisis, during the 2008 crisis, following the 2008 crisis – PRA posted high ROE and grew EPS in most years.
In 2014 it spent $1.3 b to acquire Aktiv Kapital, a debt collector headquartered in Norway, which gave it a large presence in Europe. This followed the 2012 acquisition of a small UK player. In 2015 it entered the Brazil market.
Operations
PRA primarily operates in the US and Europe. Australia, Canada, and Brazil are secondary markets.
The business consists of purchasing overdue consumer debt from banks, consumer finance firms, and retailers. In the US this is often done via ‘forward flow’ transactions, in which a master agreement leads to multiple purchases of similar NPL portfolios over a several month period. In Europe, ‘spot’ transactions are more common. In the US and UK, credit card receivables are the major asset class, while in continental Europe other forms of personal credit are the norm. Overall, the portfolio includes credit card receivables, personal loans, auto loans, and small business loans.
As of June 2024, the portfolio of receivables was $3.8 b. Estimated remaining collections (ERC), which is the company’s estimate of undiscounted future cash collections, stood at $6.8 b. The ERC mix was:
· Europe 51%, of which the core portfolio is 94% and insolvency portfolio is 6%. The UK is 44% of this portfolio.
· Americas and Australia 49%, of which core is 92% and insolvency 8%. The US is 86% of this portfolio.
Whereas some buyers of consumer NPLs outsource collection efforts, PRA has historically kept most this function in-house. Call centers have been the major way to reach overdue debtors, though this is increasingly giving way to digital contact. It also pursues legal channels.
To what extent is there a moat around this business? Some thoughts:
· Proprietary data going back more than 20 years is a major competitive advantage. Whereas some data may be available for purchase from vendors, a new entrant would not be able to replicate the enormous intel on consumer payment history based on a range of criteria.
· Qualifying as an NPL buyer. Due to concerns about legal liability and reputation, large financial institutions are not willing to sell bad consumer assets to merely the highest bidder. They need assurance that the buyer will comply with all relevant regulations and laws.
· There is an opportunity to generate cost economies of scale. Collection efforts require a fixed cost base in the form of collection staff and IT. An incumbent with a large portfolio should be able to have a lower cost of collection compared to a smaller new entrant.
· Regulation has intensified compared to the company’s early days. Whilst increased regulation burdens incumbents with compliance costs, these expenses can be insurmountable to a new entrant.
Market share figures are unclear, but it may control ~30% of both the US and Europe markets. Encore Capital Group, the major peer, is a similar size.
PRA’s LT track record supports the view that there is some moat around it. Since 2003, the first full year after listing, the average ROE has been 15%. Encore has generated a 17% ROE during this period.
Capital intensity and cyclicality are negative features of the business.

What went wrong & seeds of a recovery
In addition to the 2023 loss, ROE was <10% in 3 of 5 years between 2018 and 2022. What went wrong?
There are 5 primary drivers of earnings:
· Volume of receivable purchases
· Price paid for receivables
· Performance of the portfolio post-acquisition
· Cost of collection
· Financing cost
Some of these variables are intertwined. The first two are connected in that the lower the supply in the market, the less attractive pricing (from the perspective of the NPL buyer, whereas the reverse is true for the original creditor). And vice versa. The cost of collection is partially a function of volume, in that collection operations become underutilized in a period of low purchases.
Now back to the earnings drivers.
First, let’s look at supply in the US. A good proxy is the $ amount of overdue credit card receivables. The balance peaked in 1Q 2010, in the aftermath of the 2008 crisis. There was plenty of supply for PRA and its peers in the 2010-2012 period, as card issuers unloaded bad assets. Fast forward to 2014-2016, there was limited stress and accordingly, little for card issuers to sell. The current picture has improved dramatically. In June 2024, even without the recession that never arrived, overdue card assets have reached record highs. The arithmetic is simple – credit card balances are at all-time highs ($1.1 trillion) and the delinquency rate has risen to elevated levels (10.9%).

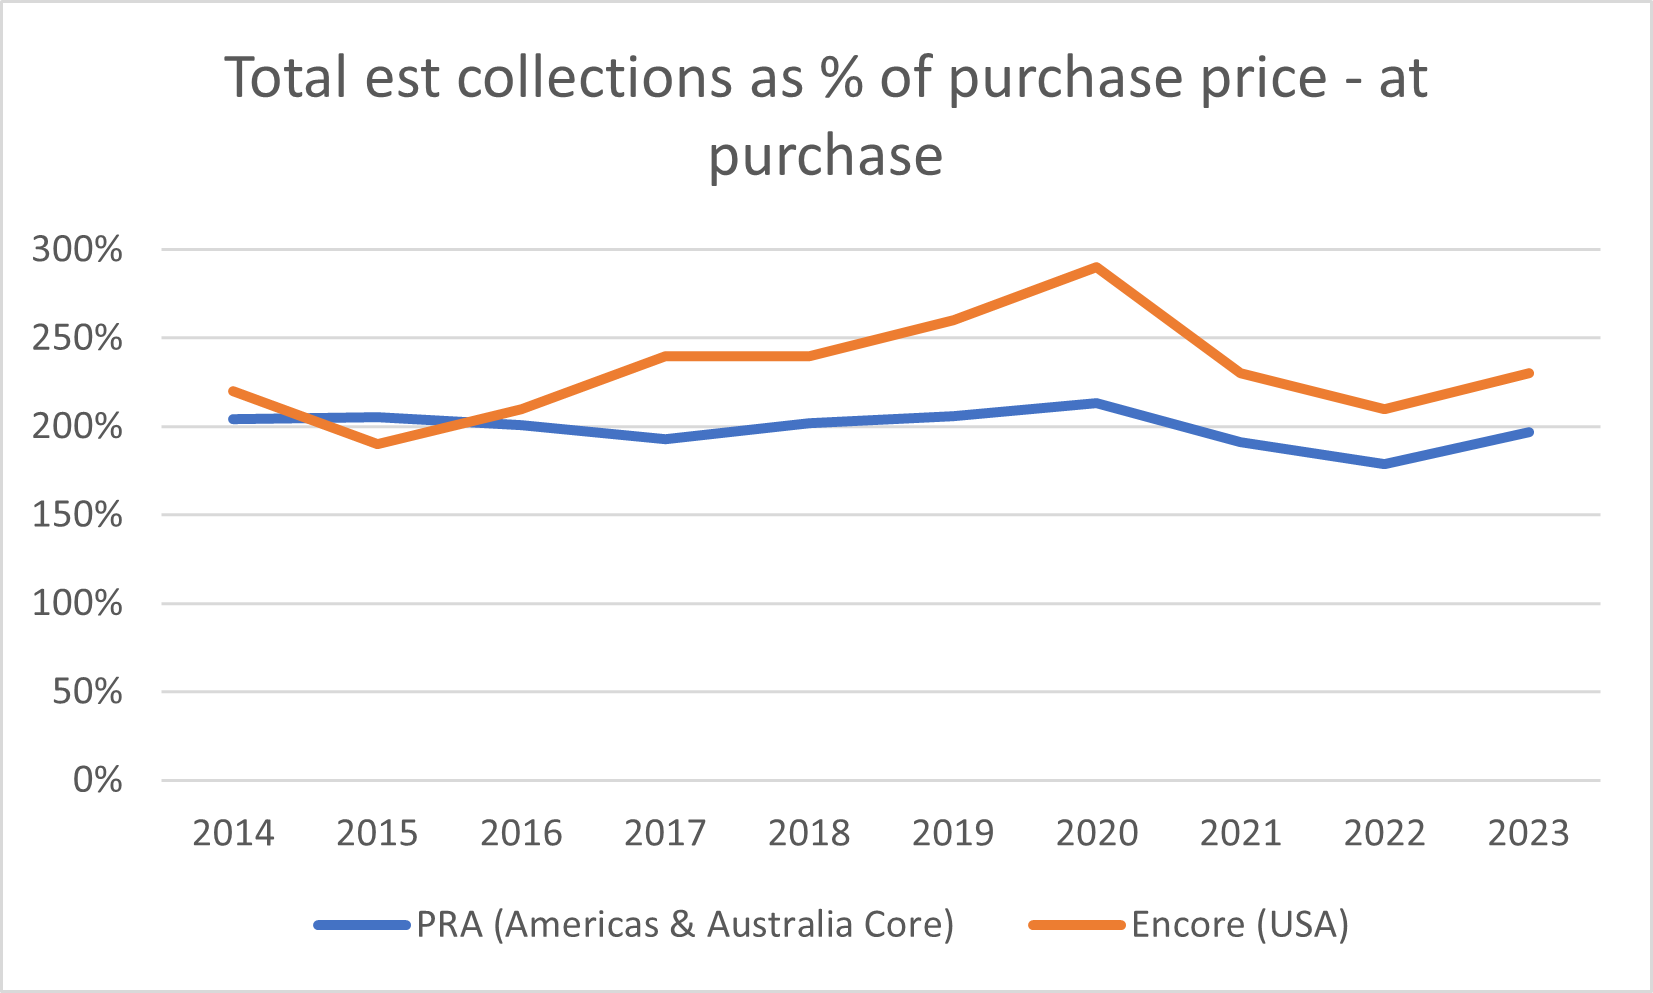
Pricing of portfolio purchases is measured as a % of the total estimated collections. For its Americas and Australia core portfolio, which is mostly US card assets, pricing follows the basic direction of supply. From 2009-2011, upon purchase PRA expected to make cash collections equal to ~250% the value of the purchases. Supply was amble then, and debt collectors paid low prices. As supply weakened, PRA was buying portfolios on lower expected returns – closer to 200% from 2014-2016 and just 193% in 2017. There was some improvement in 2019 and 2020, following more by aggressive pricing in 2021 and 2022, once again due largely to lower supply. Encouragingly, pricing has improved since.

The third major driver is how a portfolio performs after it has been purchased. Disclosed purchase price multiples are based on estimates of future collections. Actual collections may be quite different. Drivers are the quality of the original underwriting, the economy, collection techniques, and other factors.
The spaghetti soup below shows how annual vintages for the Americas & Australia core portfolio have performed (through June 2024, with the 6M period counted as a year). Ideally, a line trends higher over time, i.e. purchase at 200% of total expected collections and, several years later, the vintage is expected to produce collections equal to 250% of the purchase price. Vintages in 2021 and 2022 have been disappointing performers. The main theory is that the pandemic and related stimulus checks did not fit well into models based on historical data. The 2021-2022 vintages include accounts written-off while borrowers were collecting ‘stimmies’ – the suggestion is that these borrowers had the means but not willingness to pay their debts. Hence, disappointing vintage performance. The 2023 vintage shows stability.

The final two earnings drivers are more straightforward:
· Operating costs are mostly fixed. Payroll is ~40% of total and there are additional costs related to physical operations. In a period of declining revenue, the company cannot cut overhead costs to the extent to which collections and revenue are declining. The LT trend has been for improved efficiency.
· ~50% of debt is floating rate, though much of this exposure is hedged, meaning 70% is effectively fixed rate. The company discloses that a 50-bps reduction in interest rates would lead to a $5 m reduction in financing costs. Assume 250 bps, currently what futures markets are expecting from the Fed, and PRA could have meaningful cost savings.
A final thought on PRA’s problems – to some extent they were self-inflicted. In comparing data with Encore, two items jump out:
· For several years PRA was paying higher prices (i.e. less as a % of total estimated collections) in acquiring NPL portfolios compared to Encore. PRA’s rebuttal, for what it is worth, is that there are other considerations – for example the cost to collect.
· Encore has not had the problem of disappointing 2021-2022 vintage performance to the extent of PRA.

PRA management has been held accountable. The CEO from 2016 until March 2023 (co-founder Kevin Stevenson) is gone. There have been two positions filled with external hires – the CFO in May 2022 and Head of Risk & Compliance in February 2024. In early September it announced the hiring of a Global Chief Data & Analytics Officer from McKinsey.
The new management team has rightly stressed disciplined portfolio purchases and improving operational efficiencies.
What about Europe?
The same basic drivers of the business are relevant in Europe. So how do they look? Overall, mildly encouraging:
· Supply – 90-day overdue UK credit card balances have risen ~50% from mid-2022, though remain far below the level of several years ago. Continental Europe is less transparent in terms of delinquencies. The total stock of consumer credit is at an all-time high.
· Pricing – in PRA’s core Europe portfolio, pricing in 1H 2024 (183% of total estimated recoveries) is the best since 2014.
· Vintage performance – the upward sloping lines (see below) show positive performance versus original expectations.
Are earnings set to recover? And is the stock cheap?
So, there are lots of variables – market supply, portfolio purchase pricing, portfolio performance, operating leverage, and cost of financing.
Complicating matters is the accounting for revenue recognition. There are two components of revenue:
· Portfolio income (typically ~90% of revenue) – expected recoveries based on the constant effective interest rate for a pool of receivables.
· Changes in excepted recoveries (typically ~10% of revenue) – difference between actual and expected recoveries for the period, in addition to the NPV change in the ERC at the constant effective interest rate.
As the above suggests, a cash recovery of $100 isn’t recognized as $100 of revenue. A portion of the $100 is booked as portfolio income, while the remaining amount reduces the outstanding balance of receivables. An external analyst cannot allocate the % of cash recovery between the two items with any certainty. It is driven by the portfolio effective interest rate and collection trends versus expectations.
Hidden on Leahi Capital’s hard drive is a model which estimated all these variables going forward – portfolio purchases, collections, allocation of collection to income / balance sheet, etc. The risk of ‘garbage in, garbage out’ is too high to make it worthwhile.
Instead, focus on the direction of earnings and things we know with reasonable certainty:
· The 18-24M supply outlook looks favorable due to the US credit card market.
· From the perspective of the NPL buyer, pricing has improved and will likely get better.
· Poor performing historical vintages (2021-2022) have been identified and adjustments made.
· Funding costs may be set to decline.
· New management is in place.
· PRA booked a small profit in 1Q24 ($3.5 m, annualized ROE of 1%), and moderate profit in 2Q24 ($21.5 m, annualized ROE of 8%).
The rising ERC suggests earnings are set to recover further.

Current multiples suggest limited downside and lots of potential upside. The P/TB multiple is 1.1x, which compares to a median of 2.5x from 2009 to 2023. Another interesting metric is comparing the enterprise value to ERC. Currently, this is 58%, near the historical low. If this can regress to 70% (historical median) the stock price would be $42 – nearly double the current price.

Management & corporate governance
Institutional shareholders hold large stakes – BackRock 17%, Vanguard 11%, Wellington 10%, T Rowe Price 7%.
Insider ownership is ~4% of total. The Chairman and co-Founder (Steven Fredrickson) owns 332k shares, valued at $6.9 m. He owned 7% of the company in 2002, sold most of the shares in the following years, and has been rebuilding his stake over the past decade. The CEO (Atal Vikram) owns shares worth $4.1 m. There has not been much insider buying and selling in recent months.
All 12 directors save the CEO are officially considered Independent, although the Chairman (a co-founder and former CEO with 22 years on the board) should probably not be considered so, as is true with another director who has been on the board since 2004. Most directors have credible backgrounds in banking and finance in the US and Europe.
The current CEO (Vik Atal) took over in March 2023. Ex-Citi, he had been a non-executive director since 2015 and was brought in to run the company following the poor performance. Since then, there has been considerable turnover amongst senior management.
Compensation for executives includes:
· Salary
· Annual bonus – based on GAAP net income, adjusted EBITDA, strategic objectives related to cash collections, portfolio investments from new customers, products, or geographies, costs, and strategic transactions.
· LT incentives – these are equity awards based primarily on adjusted EBITDA and total stock return.
Note there is no ESG/DEI component in the executive compensation.
There have been plenty of share buybacks over the years – current outstanding shares are 23% below the 2011 figure. To be fair, most of the buybacks happened at prices well above the current level.
Disclaimer: The information contained in this report is for general informational purposes only and does not constitute investment advice or a recommendation to buy or sell any securities or other financial products. The opinions expressed in this report are those of the publisher and are subject to change without notice. Readers are advised to conduct their own research. The publisher does not guarantee the accuracy, completeness, or reliability of any information in this report, and disclaims any liability for any losses or damages arising from the contents of this report. The publisher of the report often invests in companies about which it writes.
In the Q3 CC, they said capital return isn’t a priority for them in 2025. I expect earnings to continue ticking up here but I don’t see any clear catalysts outside that.
Just found your Substack and really enjoying the write-ups. Definitely assisting in that initial searching phase!
Would be interested in your take on Nam Cheong (SGX: 1MZ) some interesting potential there that Ive had brought to my attention.